Introduction
About 10% of sub-Saharan Africa’s land area is considered arable. The economic value of agricultural production (i.e., the sum of crop and livestock production values) is unevenly distributed across the continent.
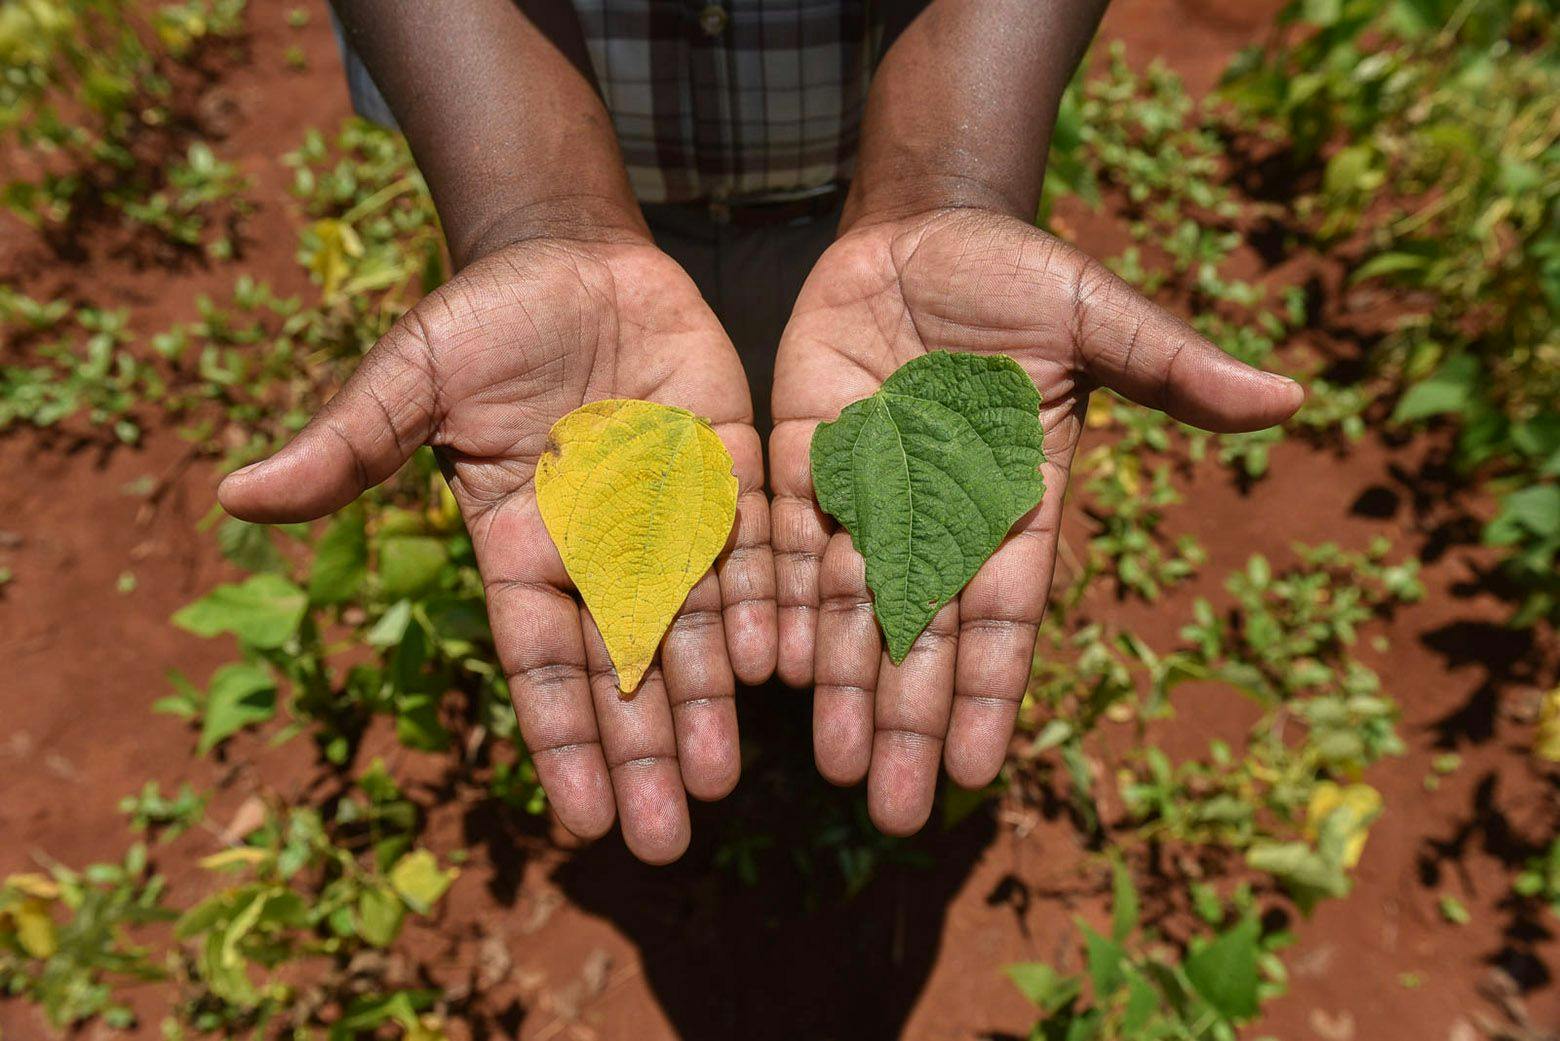
Image credit: ©2016 CIAT/NeilPalmer
High values are concentrated in 2% of the total crop production area
On average, less than half of the arable area generates annual production worth more than USD 500 per hectare. While some areas can produce food crop outputs worth more than USD 5,000 per hectare, such high values are concentrated in 2% of the total crop production area and are likely boosted by access to irrigation and cultivation of high-value crops.
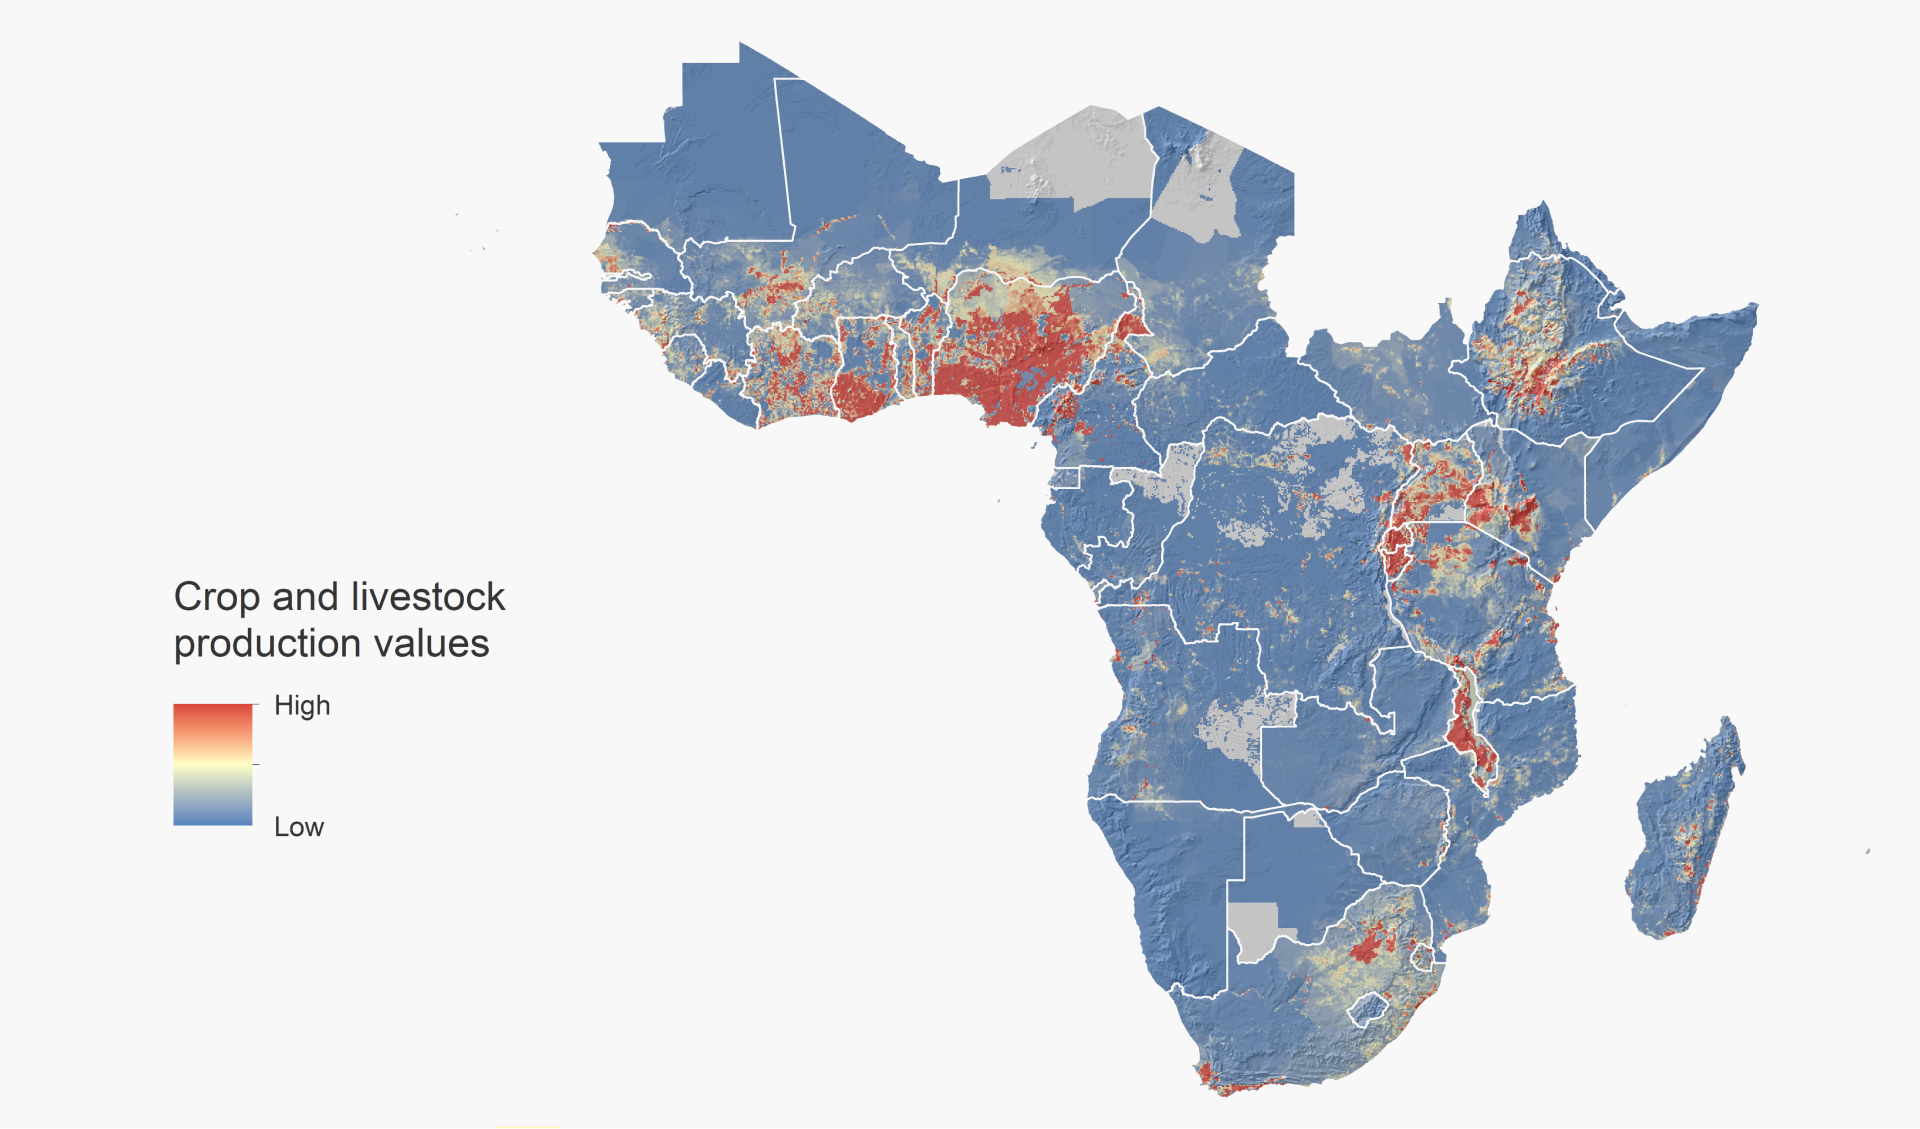
Map 1 Agricultural value of production, including crop and animals (international dollar per ha).
Rural poverty and food insecurity are pervasive, especially where non-farm employment options are limited
With farmers typically cultivating small plots to support their families, rural poverty and food insecurity are pervasive, especially where non-farm employment options are limited. Our analysis of the nationally representative household surveys and agricultural census data from 14 sub-Saharan African countries shows that the majority (83%) of economic value of crop production (i.e., converting the amount of crop produced into money) for cereals, pulses, oil crops, and root crops are generated from farms smaller than five hectares in area.
Smallholders with less than two hectares generate the economic production values of 48% for cereals
In some of the countries, such as Kenya, Malawi, and Rwanda, more than 80% of crop production values come from even smaller fields of less than two hectares. Overall, across 14 countries, these smallholders with less than two hectares generate the economic production values of 48% for cereals, 55% for pulses, 44% for oil crops, and 70% for root crops.
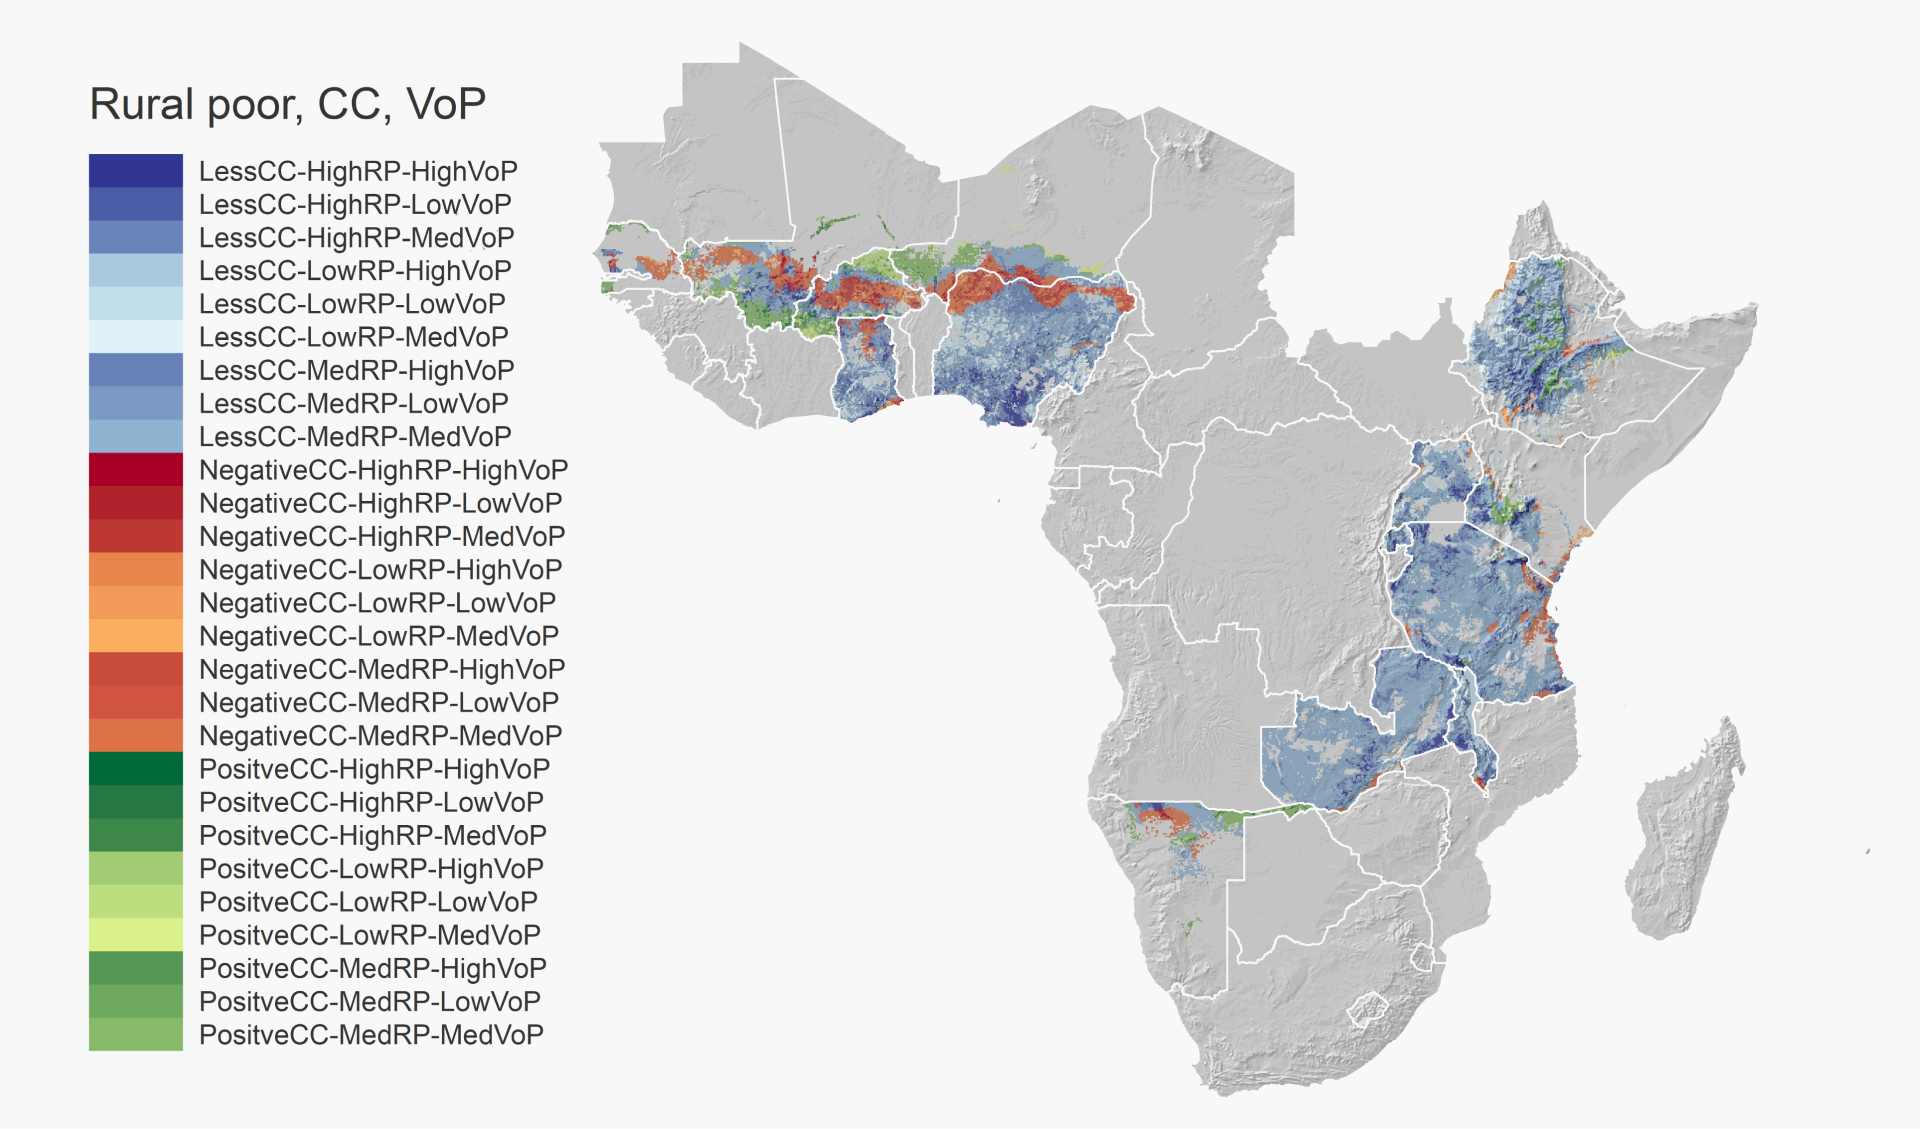
Map 2 Three-level (high, medium or low) classification of three variables, including the climate change impacts on the suitability of cereal crops (CC), the density of rural poor (RP), and the value of cereal crop production by smallholders with less than 2 ha farms (VoP). Data in each dimension was normalized as Z-score (low: Z<-0.67, medium: -0.67<=Z<0.67, high: Z>=0.67).
Areas should be prioritized for climate change adaptation and their contribution to the country’s economy
We further disaggregated the smallholder-produced crop production values into 10x10 km2 pixels. This analysis can provide useful insights into the spatial pattern of agricultural production values in each country and, thus, which areas should be prioritized for climate change adaptation and their contribution to the country’s economy. When overlaid with the decreasing suitability of cereal crops projected in 2030 and the prevalence of rural poverty, some hotspot areas were identified across the studied countries.
Important cereal production in areas of rural poverty coincide disturbingly with negative climate change impacts
Overall, the analysis shows that the majority (>80%) of smallholder produce does not face significant climate change impacts by 2030. However, in some countries, important cereal production in areas of rural poverty coincide disturbingly with negative climate change impacts, as seen in Burkina Faso (43% of cereals Value of Production* at risk), Ghana (26%), Niger (21%), Mali (20%) and Nigeria (18%).